Foursquare
- ClientFoursquare
- IndustryTech
- ServicesBranding · Data, Research & Testing
- CapabilitiesContent strategy · Customer/Audience research and insights
Quantitative and Qualitative Data Live Together
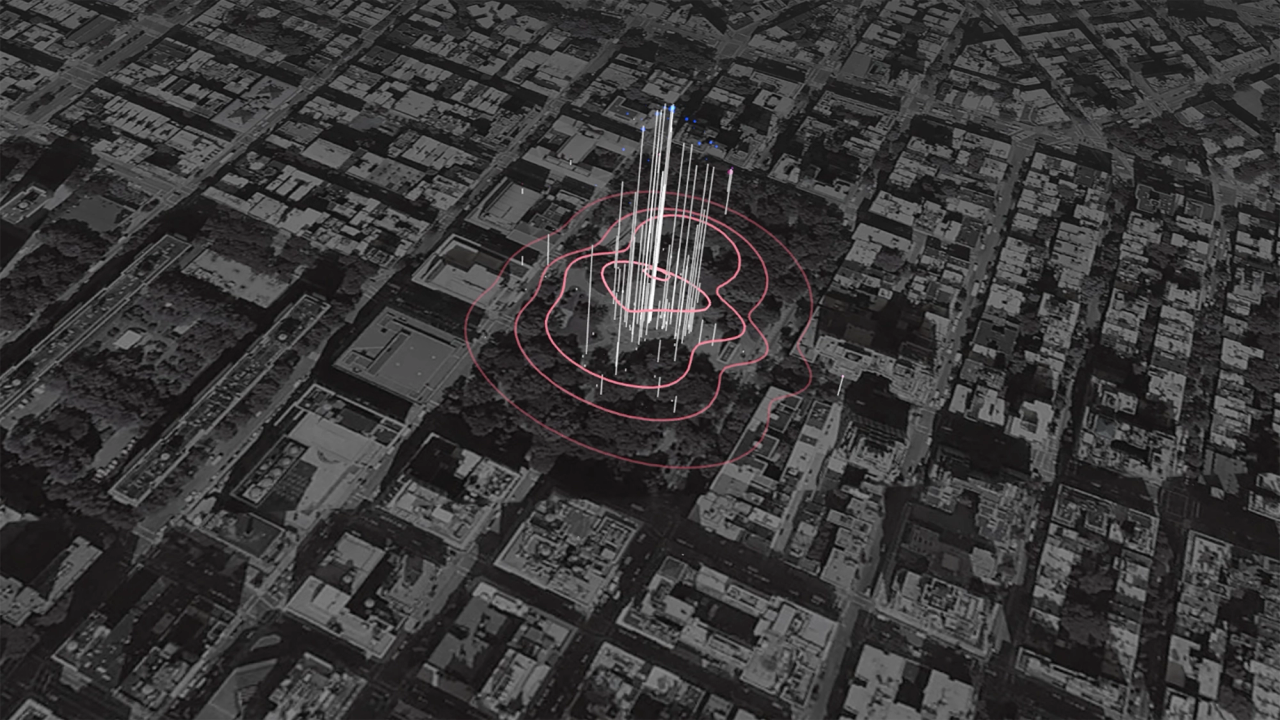
In late 2015, Foursquare came back to Code and Theory to take the visualization a step further. We helped communicate how Foursquare impressions, clicks and conversions data could be visualized in different geo-locations, using additional data like venue demographics and its proprietary “taste” data.
We built upon our 3D storytelling world to create an animation sequence depicting the relationship between impression and conversion data. First we placed the data in an abstract space and then placed those data points in the real world on a map. The sequence then zoomed into of a specific venue to display a series of charts with gender and age distributions, top categories and tastes.
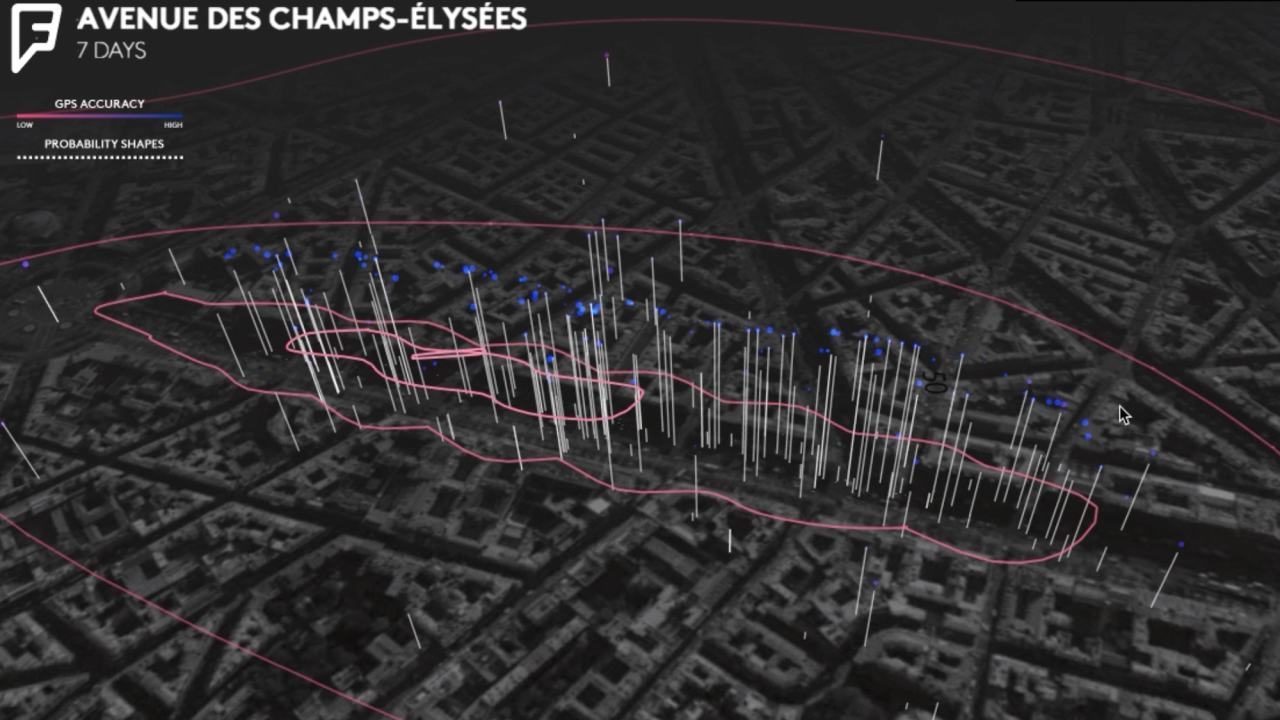
Turning location intelligence into clear, credible insights teams can act on
Foursquare had a powerful view of how people move through the world and what those patterns say about interests and intent. The opportunity was turning that richness into something clear and credible enough to act on.
We helped shape that story into a clear narrative system—framing Foursquare’s location intelligence in a way teams could communicate quickly and consistently. That meant defining the through-line, writing the messaging, and building a visual language that connected movement patterns, interests, and intent into a single view. The work gave teams a way to carry the story across sales materials, product touchpoints, and everyday communications without losing nuance.
Key Takeaways
Sharper location signals create a clearer picture of real-world behavior and preferences.
When qualitative context sits with performance data, insights become easier to trust and act on.
Complex data earns adoption when the story is intuitive for marketers, not just analysts.
Visual systems have more value when they flex across presentations, screens, and formats.

Representing the Data
With mounds of data and a clear profitable use case for it, there was one question: How could Foursquare clearly present this complicated information to mid-level marketers in an elegant and intuitive way?
Code and Theory worked with Foursquare to create a product that would present this information through a suite of data visualizations.
The Right Tool for the Job
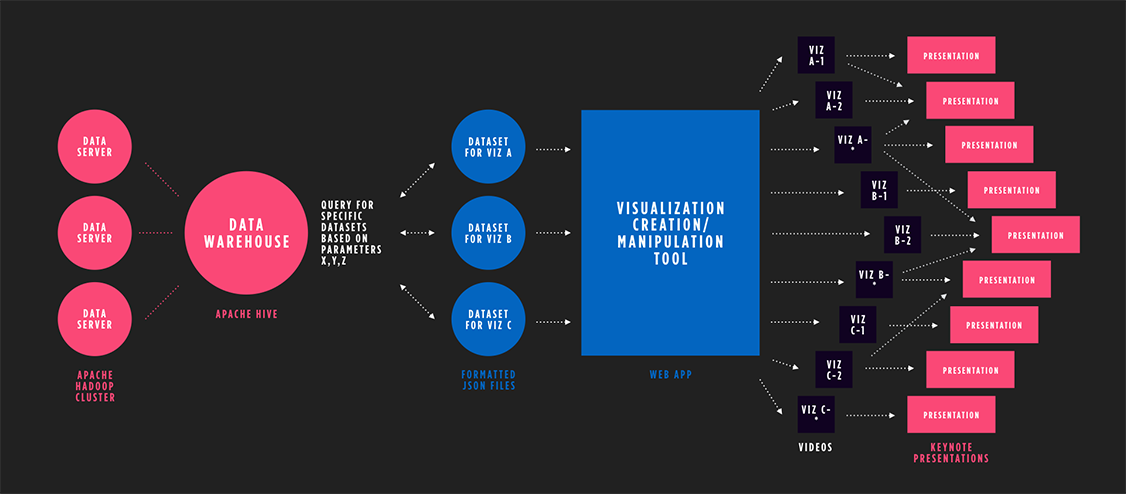
The first step in our process was understanding the story Foursquare wanted to tell. Other ad platforms offer aggregate GPS information that can roughly determine where you are, but Foursquare's platform is more precise; It combines traditional data with its proprietary data from their apps.
The next step was understanding where and how these data visualizations would be used. They needed to be flexible enough to be embedded into a sales presentation, displayed on a lobby television, as well as on-stage in a keynote presentation.
What resulted was a strategy to create a web-based tool to ingest Foursquare's raw data, have a suite of easily manipulated controls to customize the visualization, and to output HD videos that were easily adaptable to many different uses.
Pinpoint the Story
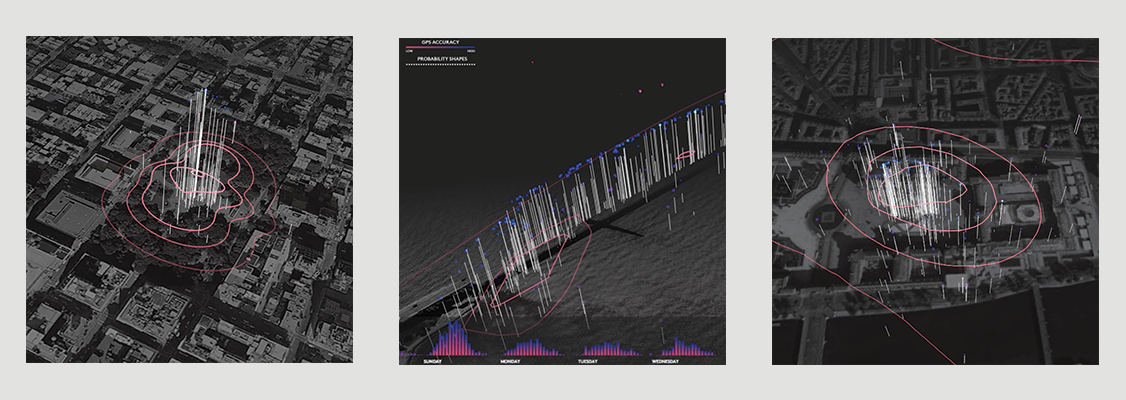
Working with our data analysts, visual designers and developers, we designed and built a system to demonstrate Pinpoint’s accuracy by projecting visual layers onto an interactive map.
Utilizing WebGL and the Mapbox API, we created a 3D world where you can see check-in data, GPS data, and Foursquare's own venue shape data for a given location. Through a set of controls these different layers are turned on and off at different moments, camera sequences are created to zoom and rotate around venues, and custom transitions can be applied. Individual venue sequences are easily placed into a queue to show an animation moving through the world from location to location, telling compelling stories.
From the High Line and Empire State Building to the Mall of America, the visualizations were sophisticated ways of honing in on geographic areas and displaying Pinpoint's accuracy.
What We Did
Web-based tool to ingest raw location data and generate customizable visualizations
3D WebGL + Mapbox interactive map layering check-ins, GPS, and venue shape data
Control panel to toggle layers, script camera moves, and apply custom transitions
HD video output pipeline for sales decks, lobby screens, and keynote presentations
Related work



Let’s get to work. Start a conversation.
newbiz@codeandtheory.comCode and Theory is a proud member of Stagwell Group. Stagwell is the challenger network built to transform marketing. We deliver scaled creative performance for the world’s most ambitious brands, connecting culture-moving creativity with leading-edge technology to harmonize the art and science of marketing. Led by entrepreneurs, our 13,000+ specialists in 34+ countries are unified under a single purpose: to drive effectiveness and improve business results for their clients. Join us at www.stagwellglobal.com
Decode
Keep up with the culture, one newsletter at a time. Subscribe to DECODE:
Find Us
One World Trade Center,
69th Floor
New York, NY 10007